

Prompt-cache measurements — tail layout vs leading layout
Live A/B measured on the production lane (OpenRouter →deepseek/deepseek-v4-flash-0731,
DeepSeek’s automatic prefix cache). Two complementary measurements:
- Harness: real message shapes through the real
manage_system_prompts_nodeagainst the real provider, back-to-back per-turn calls (what the layout alone is worth). - End-to-end: the real
/api/v1/chat-streamendpoint — full comms → executor graph, real history growth, 45-turn conversations, ~2.7M input tokens per run (what production gets).
9db9dbd6b; see “Reading the live rate”
at the end for how to measure the current number without them.
The layouts
- Before — volatile prompt slots (
todo_context,executor_status,memory_recall) sit between the stable[static, dynamic_stable]block and the conversation history. They churn every turn/step, so the provider’s byte-prefix cache can never extend past them — the conversation re-sends uncached every turn. - After —
manage_system_prompts_nodemoves the volatile slots after the conversation (OpenAI-wire providers only; Gemini keeps the leading-block layout because its API drops non-leading system messages). The byte-stable prefix becomes[static, dynamic_stable, ...conversation]and the cached prefix grows with the conversation.
1. Harness measurement — the layout ceiling
30-turn conversations, identical bytes per scenario (per-run isolated seeds), only the slot order differs. Same lane, same model, same tool binding.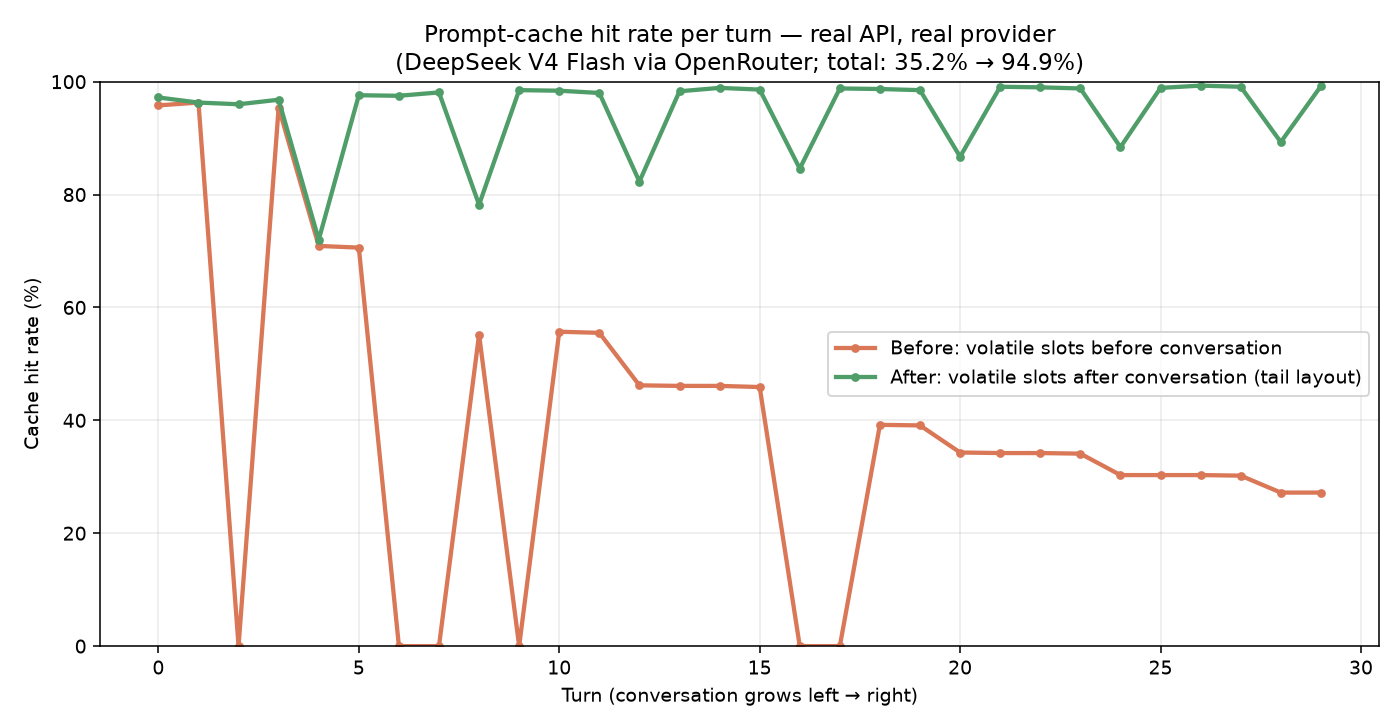
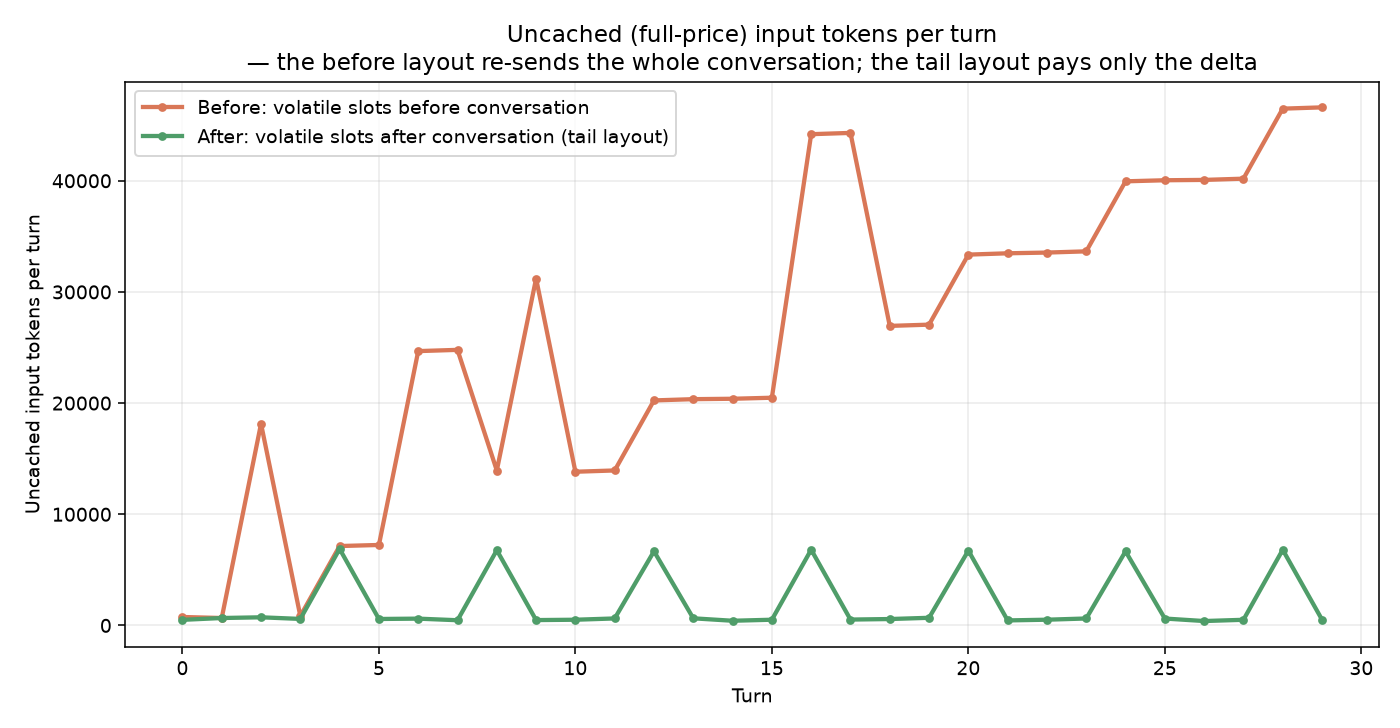
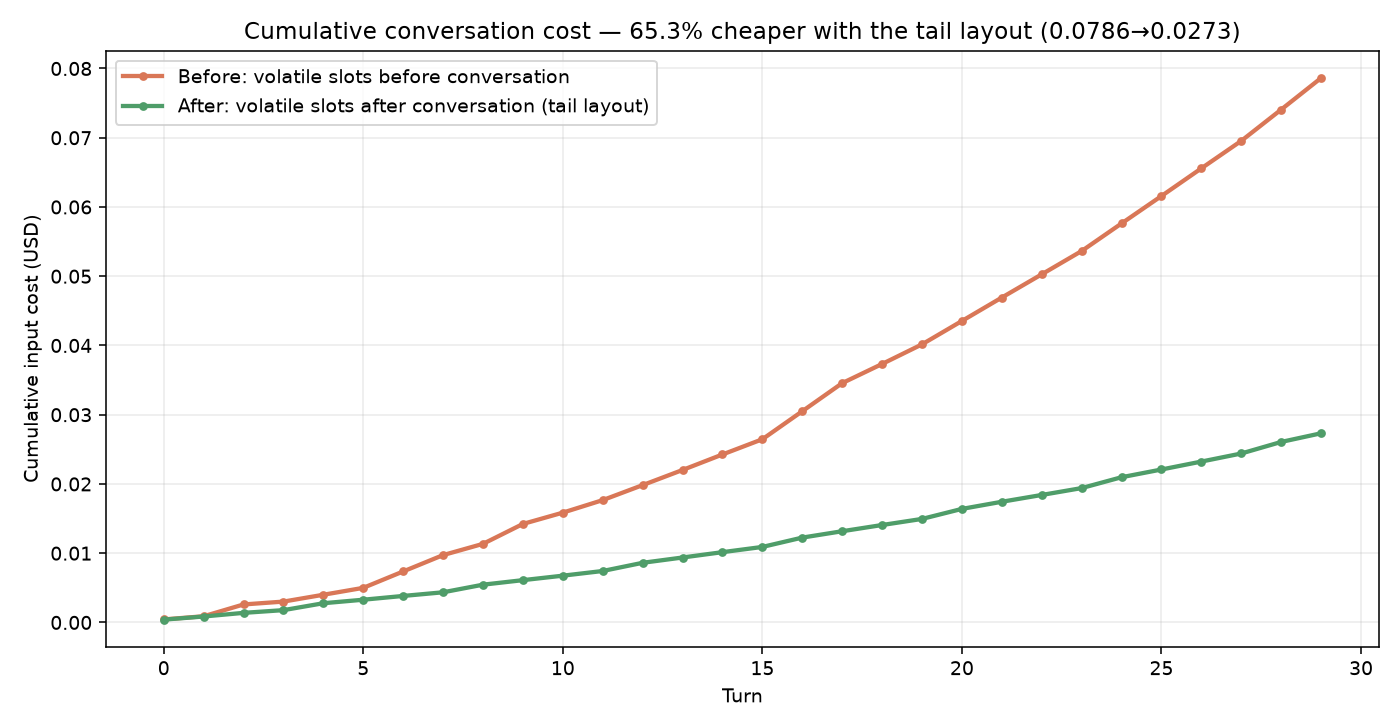
The before-layout hit rate declines as the conversation grows (the static
prefix is a shrinking fraction); the after-layout rate rises toward ~99%
(the uncached tail stays ~1–2k tokens while the prompt grows).
2. End-to-end measurement — the real graph
45-turn conversations driven through the real chat endpoint (comms → executor, memory extraction, follow-up actions, tool results) on the same machine and upstream, before vs after the layout change.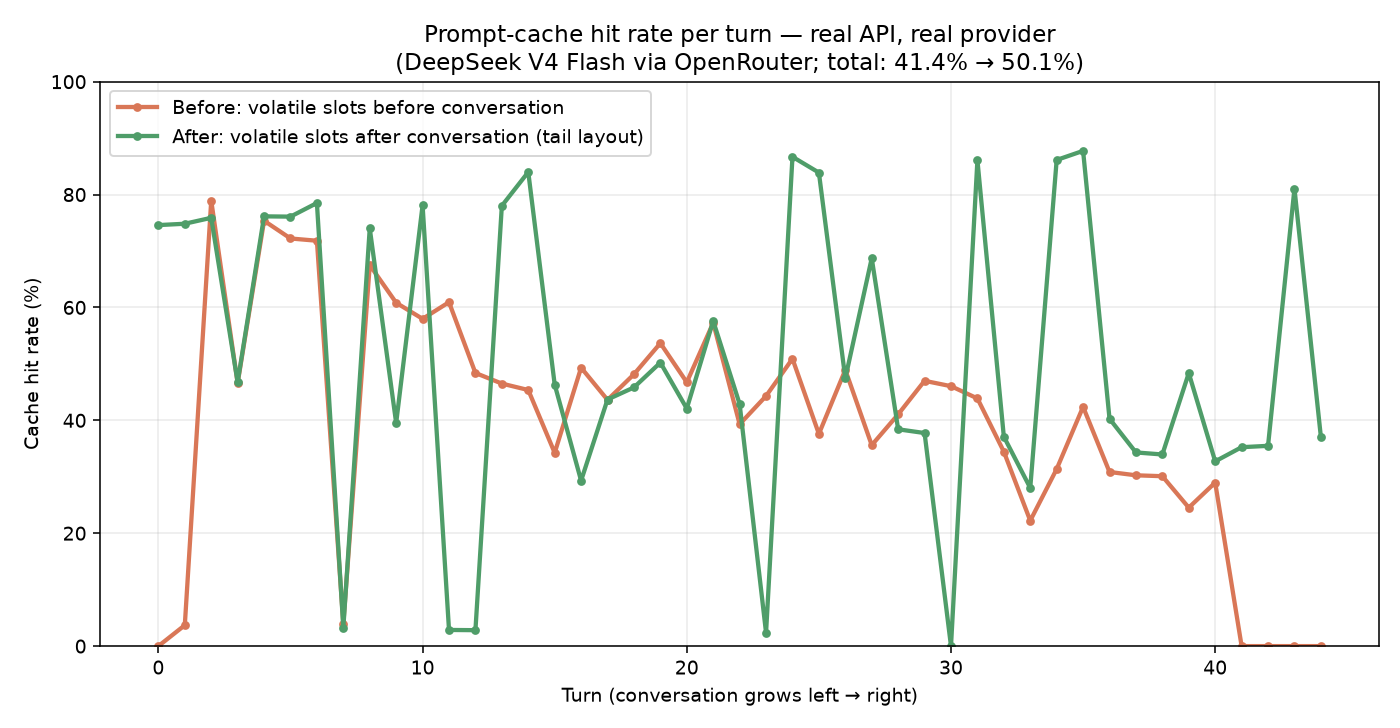
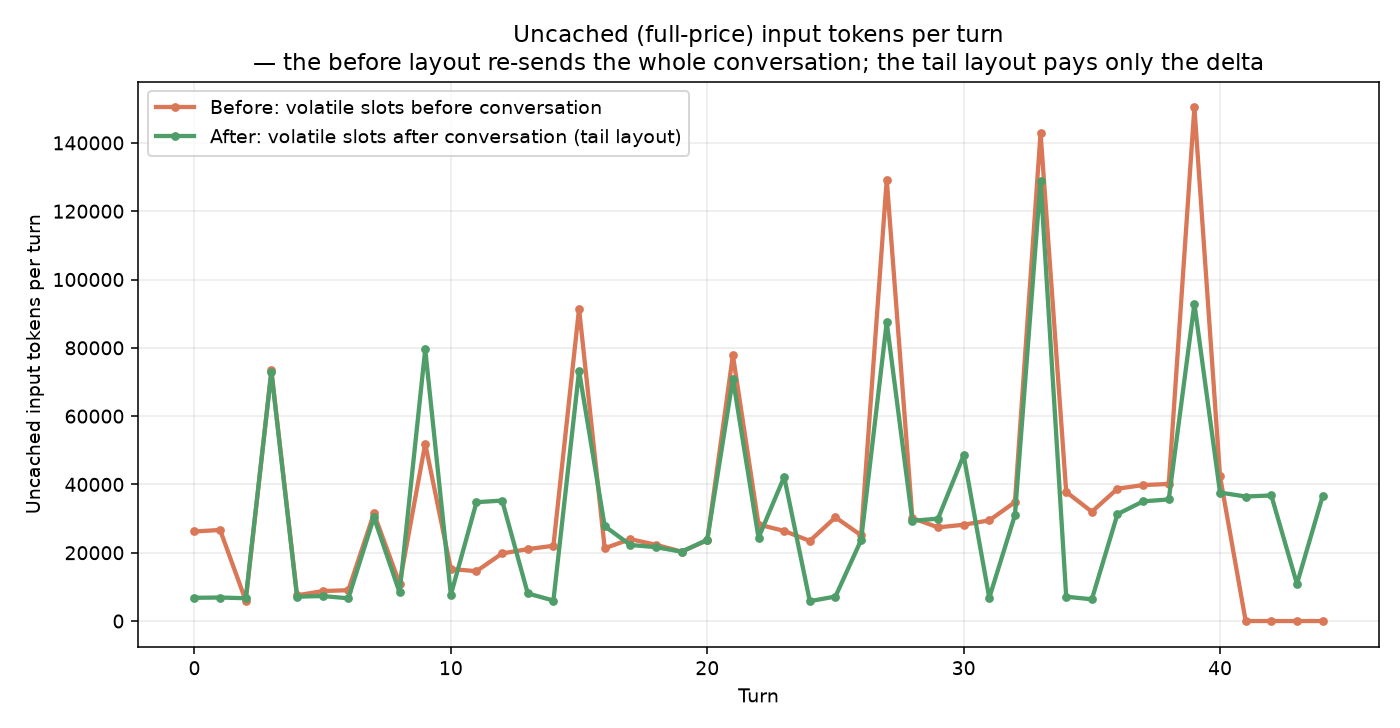
The earlier “70–73%” figure was superseded: it came from a measurement run
whose aux-namespace fix was later found to be dead code on the wire (the
alias never reached the requests). After the real wire fix, the honest
figures are 72.4% (wire capture + provider-reported usage, 56 requests) and
70.5% (the 15-turn driver).
The e2e delta is real but the residual gap is NOT a layout defect and NOT
provider-side flakiness — both of those earlier hypotheses were measured and
disproved. The shadow test settled it: replaying the graph’s exact captured
request bytes seconds after the live call hits 99.5% while the live call
itself reported 80% — the cache is a byte-prefix cache working exactly as
specified, and the live hit rate is the shared-prefix fraction. The per-turn
byte divergence has two measured sources:
- The memory-recall slot churns inside the cached prefix. The volatile slot is rebuilt every turn; its tail (recent-activity journal + tracked todos) changed bytes every turn — the journal’s sliding last-6 window shifted every emitted entry each time a new one landed. The comms’ shared-with-previous-turn prefix was capped at ~18k (static + docs) while the request grew to 23k+. Fixed: the journal is now anchored (append-only) — shared-with-previous-turn went 50% → 74%, and the comms’ cached prefix now grows with the conversation instead of staying flat.
- Concurrent same-provider requests wipe each other’s chains mid-read. The memory extraction is a fire-and-forget background task that overlaps the next turn’s requests. A/B on the same lane: the comms chain collapsed to 0/72.6% under a concurrent alias-lane extraction and held 99.5%+ under a concurrent Gemini extraction. Fixed: the memory pipeline runs on direct Gemini — a different provider has no shared cache store.
- Sticky model fallback — when the primary fails and the fallback serves
the call, the request’s
modelfield flipped per call (primary → fallback → primary → …) and the per-model cache could never chain. Once a run falls back, later calls use the fallback directly. - Aux calls get their own cache namespace — the follow-up and other
one-shot calls now run under a different id (
AUX_MODEL_NAME), so their ~30k tokens/turn of new blocks can no longer evict the conversation from its namespace. Note this is a genuinely different model, not an alias of the same weights: OpenRouter servesdeepseek/deepseek-v4-flashas “V4 Flash 0423” (Apr 2026) and…-0731as “V4 Flash 0731” (Jul 2026), at different rate cards. There is no second id resolving to 0731, so a separate namespace and the newer revision cannot both be had on this provider — the aux lane trades model version for isolation, deliberately. The memory pipeline is NOT covered by this: a separate id on the same provider was measured and did not hold (see the concurrency finding above), which is why it runs on direct Gemini instead.
session_id (sticky routing, forced
from the FIRST request) — measured 0/100/99/99/99/99/99 on an isolated
growing conversation with the session_id alone. Explicit provider routing
was measured WORSE (sort:price 35.6%, first-party pin conflicts) and was
removed. The residual gap to 99% is the per-turn content that SHOULD
change: the new turn’s messages, the volatile tail (~370 tokens), and the
follow-up one-shot (~2k at its ~65% ceiling because its per-turn context
churns) — plus occasional provider-side flakes (2 turns in 15).
History — the first session_id attempt, and why the shipped one differs.
An earlier revision pinned the conversation id on every request including
the aux one-shots, via a post-bind_tools bind, wire-verified at 100%
coverage. That A/B measured no benefit (64.2% pinned vs 70.5% unpinned)
and was reverted: sharing one session across the conversation AND its aux
calls fragments the byte-identical ~19k system prefix across per-conversation
upstreams, so a new conversation starts cold (turn 0: 0% cached pinned vs 79%
unpinned, the unpinned run hitting a warm upstream’s copy of the shared
prefix).
What ships is not that. The aux one-shots now carry their own suffixed
session ({session_id}-aux, see _aux_structured_runnable) precisely so they
cannot re-pin the conversation’s provider, and the sticky-flip retry recovers
the cold-flip case rather than relying on the pin alone. Measured best on the
real full graph in that shape — 82.2% total, 83–88% steady-state (recorded
against DEFAULT_MODEL_NAME in app/constants/llm.py). The reverted variant
is kept here so the shared-session version is not re-attempted without new
data; it is not a statement about the shipped one.
This PR also bounds the aux calls’ cache footprint so the fix is in place
when the request count drops: the volatile memory-recall slot is capped at 8k chars
(head+tail), cutting ~30k tokens/turn of new cache blocks. The remaining
lever to unlock the layout’s demonstrated 95% ceiling in the real graph is
reducing the number of requests between comms calls — batching the
memory-pipeline calls (extraction/reconcile/consolidate run 2× per turn, once
per agent thread) and/or the executor’s per-turn loop — a memory/agent
pipeline change, not a cache-layout one.
Semantics (verified, not assumed)
- DeepSeek applies system messages that appear after the conversation when a leading system message exists; the earliest system message wins conflicts, so the static prompt keeps authority (probed live).
- Facts and directives in the tail system slot reach the model (
tealfrom a tail fact; todo directives followed). - The cache reports in 128-token blocks (every reported value is block-aligned); it is global per key and LRU-evicted, so each scenario run uses unique conversation bytes and only measures its own writes.
What changed
apps/api/app/agents/core/nodes/manage_system_prompts.py — provider-aware
layout:
openrouter/custom(OpenAI-wire): volatile slots move after the conversation → tail layout.gemini: unchanged leading-block layout (its API silently drops non-leading system messages).- Missing provider: defaults to the leading layout (today’s behavior).
How it was measured
A live harness drove graph-shaped conversations (realmanage_system_prompts_node,
real provider, per-run isolated bytes) for the layout A/B, and the real
/api/v1/chat-stream endpoint was driven for the end-to-end runs. Requests
were captured byte-level through a logging proxy to verify determinism and
the exact divergence points.
Those driver scripts were deliberately removed in 9db9dbd6b — they billed real
tokens on every run, and their findings are recorded above. Do not go looking for
them. To read the rate as it stands today, use the method below instead: it costs
nothing and answers the same question against real traffic.
Reading the live rate (free, repeatable)
Every LLM call already emits anllm_call wide event carrying input_tokens
and cached_tokens. Reading them needs no driver, no tokens and no deploy —
only Loki:
sum(cached_tokens) / sum(input_tokens).
Three things decide whether the number is true. Each was got wrong at least once:
- Query both services.
arq_workeris a separateservicelabel and carries the memory and workflow lanes.gaia-backendalone reported 51.5% against a true 39.8% — twelve points of pure selection bias. - Drop
sticky_flip_discarded="true". Those are retry replays of bytes just sent, ~99% cached by construction. Counting them flatters every aggregate. - Weight by tokens, not by call. A mean of per-call rates lets a handful of tiny one-shots outvote the 40k-token subagent calls that carry the cost. Tokens are what is billed, so tokens are what the metric is.
agent_name for the per-lane split, and chain by thread_id in time
order to separate a genuine cold start from a cache that was lost. Note that
threads are strictly per agent (<conv> is comms, executor_<conv>,
<subagent>_executor_<conv>), so anything about agents evicting each other
has to be looked for at the conversation level — the trailing id segment — not
per thread. A per-thread comparison cannot see it and will report zero.
Baseline, 24h to 2026-08-24 (pre-#1095)
39.8% overall. The three agent lanes are 84.8% of all prompt tokens and 47 of the 60 points of loss:The shape that matters
The loss is bimodal, not spread. When the cache works it reads over 90%; almost all loss is calls reading exactly zero — 44.5% of comms calls, 54.1% of subagent calls. Splitting those by whether they were the first call on their thread is what turns the number into a plan:- Lost warm caches — 118 calls that were not first on their thread yet read 0% (4.1M tokens, ~19 pts). 87 of them fired within 60s of the previous call on the same thread, on the same model: far too fast to be expiry, so these are prefixes being invalidated. At the conversation level, 29% had another agent of the same conversation run in between (shared routing key) and 71% did not (churn inside one agent’s own chain).
- Cold first calls — 117 calls (4.0M tokens, ~18 pts). Not inherently
unavoidable: in the same window 21 of 69 comms first-calls read 69.3%, 17
of 51 executor first-calls read 60.0%. The static prefix is byte-identical
across conversations for an agent, so it is already warm somewhere. Closing
that gap is worth ~11 pts — but note
session_idis bound on every request today and those 21 still hit, so “pinning prevents landing warm” is not established. It needs an A/B, and an earlier broader pinning change measured worse and was reverted. - No
thread_idat all — the background lanes cannot chain or route stickily.memory:reconcile,consolidateandepisode_summaryare 100% cold but average 960 / 1,038 / 257 tokens per call, below the provider’s minimum cacheable block, so there is nothing to win there.
VOLATILE_BLOCK_MAX_CHARS only helps calls that are already
warm, and those already read 90%+.
What the shape of the prompt permits
Fixing every bucket above does not get you an arbitrary number. The ceiling falls out of three measured quantities, and it is worth knowing before anyone sets a target. The graph lane’s mean prompt is 35,132 tokens (532 calls, 24h). On a warm mid-conversation call the bytes that must be re-read are the volatile block plus the turn’s own new text (~400 tokens, generously):volatile_tokens, and it needs no deploy to read:
assemble_context already records memory_recall_chars — the size of the whole
volatile block — on the dynamic_context wide event for every assembly
(assemble.py). Measured over 24h in production:
Mean rather than median, because a token-weighted rate sums bytes and the
distribution has a long tail (comms medians 2,155 against a p90 of 6,500). The
8,000-char cap truncates only 1.1% of calls, so it is working as the backstop it
was meant to be and is not what sets the ceiling.
First calls are blended in at 69.3% — the best observed in production — because
they can inherit the shared static prefix but never a conversation.
So the answer to “can we hit 90–95%”: yes, the range is reachable. The
warm-call ceiling is ~96.8%, and a realistic blend lands at 91–94% depending
on what share of prompt tokens are first-on-thread. The bottom of the target is
comfortable once the invalidation and cold-start buckets close; the top of it
(95%) additionally needs first calls held below ~10% of tokens and doing
better than the 69.3% they currently manage at best.
Two earlier revisions of this section got this wrong in opposite directions,
both by reasoning about
volatile_tokens from a bound instead of reading it:
first from VOLATILE_BLOCK_MAX_CHARS (concluding 95% was arithmetically
impossible), then from summing each section’s configured limits, which
double-counted and came out roughly 2x high. The number had been on the wide
event the whole time.
One thing this does settle: the volatile-tail work is small. At the measured
mean the whole block is ~2% of a prompt, not the “~10 points” an earlier
estimate claimed, and most of it (recall, knowledge, agenda, todos, run banners)
is genuinely per-turn and cannot move anywhere.